Skip to content

Something unusual is happening to the power grid, and the Pacific Northwest is close to the center of it. For roughly two decades, electrical demand hasn’t deviated much, but now the region is planning for growth that’s never been seen before. The single biggest driver is the race to build data centers for AI and cloud computing. That race shows up in places you would not expect, including the monthly bill of a family in Felida or Battle Ground and the schedule of a new home in Ridgefield that just needs a transformer set.
We dug into the federal research, the regional power planning documents, and what Clark Public Utilities has published about its own outlook to answer a question we hear more and more across Clark County: what does all of this mean for homeowners and builders here?
Data Center Electricity Use Has Tripled, and It Is Projected to Double or Triple Again
Between 2014 and 2023, US data centers have gone from consuming about 58 terawatt hours of electricity to 176TWh (about 4.4 percent of all electricity used in the United States). This report came from a team at Lawrence Berkeley National Laboratory (LBNL), a US Department of Energy lab that also estimated that data center demand would land between 325 and 580 TWH by 2028. That’d be roughly 6.7 to 12 percent of the US’s total electricity.
Its 2025 update pushed the central estimate to 11.8 percent of US electricity by 2030, with scenarios ranging from 9.5 to 15.3 percent. For perspective, a single large AI campus can draw as much power as several hundred thousand homes.
US Data Center Electricity Consumption, 2014 to 2028
Terawatt hours per year. The shaded band shows the federal lab’s 2028 projection range.
| Year | Data center electricity use | Share of US total |
|---|---|---|
| 2014 | 58 TWh | About 1.9% |
| 2018 | 76 TWh | About 1.9% |
| 2023 | 176 TWh | 4.4% |
| 2028 (projected) | 325 to 580 TWh | 6.7% to 12% |
| 2030 (projected) | Central scenario | 11.8% (range 9.5% to 15.3%) |
Source: Lawrence Berkeley National Laboratory, 2024 US Data Center Energy Usage Report and 2025 Update, published for the US Department of Energy.
Why a Server Farm in Hillsboro or Quincy Can Show Up on a Clark County Bill
Your utility bills you for more than the electricity you use. Baked into rates are the costs of generation, transmission lines, substations, and the capacity needed to cover the hottest and coldest days of the year. When enormous new loads connect to a regional grid, those shared costs rise, and the rules decide how much of that increase lands on households.
The clearest example in the country is PJM, the grid operator covering 13 states from Virginia to Illinois and home to the world’s largest concentration of data centers. PJM runs an annual auction that pays power plants to be available during peak demand. For the 2024/25 delivery year, that capacity cleared at $28.92 per megawatt day. One year later it cleared at $269.92. The year after that, $329.17, pinned at a federally approved price cap.
PJM Capacity Auction Clearing Price
Dollars per megawatt day, by delivery year. The 2026/27 result cleared at a regulatory price cap.
| Delivery year | Clearing price (per MW-day) |
|---|---|
| 2024/25 | $28.92 |
| 2025/26 | $269.92 |
| 2026/27 | $329.17 (at price cap) |
Source: PJM Interconnection base residual auction results. PJM’s independent market monitor attributed 63% of the 2025/26 price increase to data center demand, roughly $9.3 billion recovered from customers in a single year.
Utility and consumer counsel estimates across PJM put the resulting residential increases at roughly $10 to $21 per month depending on the zone, starting in mid 2025. While the effect hasn’t been as severe nationally, there’s still a noticeable change. An analysis by the National Association of Realtors found that from 2020 to 2024, the residential rates in counties with ten or more data centers rose 21.4 percent. Counties without them only rose 15.7 percent. However, data centers are just one factor among several, alongside fuel prices, grid hardening, and aging infrastructure.
Residential Rate Growth Near Data Centers, 2020 to 2024
Increase in residential electricity rates by county type.
| County type | Residential rate increase, 2020 to 2024 |
|---|---|
| Counties with 10 or more data centers | +21.4% |
| Counties without data centers | +15.7% |
Source: National Association of Realtors analysis of EIA data.
How the Cost Flows Here in Clark County
The Northwest works differently from PJM, which is part of why bills here have stayed lower. Clark Public Utilities is a customer-owned public utility district that sells power at cost, and roughly 90 percent of its supply comes from the Bonneville Power Administration, the federal agency that markets power from the Columbia River dams. When BPA’s costs go up, they flow through.
And they are going up. BPA’s current rate period, which began October 1, 2025, raised its main wholesale power rate by an average of 8.9 percent and its transmission rates by 19.9 percent, and BPA tied the increases directly to meeting customer load growth. Clark Public Utilities held its own electric rates steady for 2026, helped in part by Climate Commitment Act funds, but that followed a 14 percent average increase in March 2024. The utility pointed to extreme weather, low water years, and wholesale prices; the January 2024 ice storm alone cost it about $26 million because wholesale power spiked during the cold.
None of those increases came from data centers directly. But the conditions that made them painful, a tight regional supply and very expensive power on the hottest and coldest days, are exactly what data center growth intensifies.
Residential Rates Are Climbing, Here and Nationally
While Washington’s systems ensure it has some of the cheapest residential power in the country, it’s still heading in the same direction. Their residential pricing rose from 9.87 cents per kilowatt hour in 2020 to 11.90 cents in 2024. The national average climbed from 13.15 to 16.48 cents over the same stretch, about 25 percent, reached 17.30 cents in 2025, and EIA expects it near 18 cents this winter.
Average Residential Electricity Price: Washington vs US
Cents per kilowatt hour, annual average, 2020 to 2024.
| Year | Washington (¢/kWh) | US average (¢/kWh) |
|---|---|---|
| 2020 | 9.87 | 13.15 |
| 2021 | 10.11 | 13.66 |
| 2022 | 10.26 | 15.04 |
| 2023 | 10.98 | 16.00 |
| 2024 | 11.90 | 16.48 |
Source: US Energy Information Administration, average retail price of electricity to residential customers (EIA-861, Table 5a).
Closer Than You Think: Data Centers Are Reshaping Northwest Power Planning
It is tempting to treat all of this as a Virginia problem. It is not. The Northwest has been a data center magnet for years because cheap, steady hydropower is exactly what server farms want. Oregon’s market, centered on Hillsboro, The Dalles, and the Boardman area, ranks among the five largest in the nation, and Washington is among the top 10 states by number of data centers, with large clusters in central Washington.
The Northwest Power and Conservation Council, the four state body that plans the region’s power supply, warned that data centers alone could consume as much as 4,000 average megawatts by 2029 in its high case, enough to power Seattle five times over. Its draft Ninth Power Plan, released in August 2026, says Oregon, Washington, Idaho, and Montana need about 11 gigawatts of new generating capacity by 2032. The region took a decade to add its last 10 gigawatts. BPA’s own 2026 analysis projects annual energy deficits for the federal hydro and nuclear system over the next decade.
Clark Public Utilities’ own planning tells a similar story locally. Its 2024 Integrated Resource Plan found enough energy on an average annual basis, but an existing and growing capacity shortfall at peak, projected to reach about 750 megawatts in summer and 500 megawatts in winter by 2044 without new resources. It also expects to shift from a winter peaking utility to a summer peaking one as air conditioning spreads across the county. In October 2025 the utility moved to BPA’s Load Following product, which hands much of that peak responsibility to BPA.
How much of the cost lands on households is now a live policy fight. Oregon regulators approved a separate data center rate class for Portland General Electric in 2026. In Olympia, House Bill 2515, which would have required large data centers to cover the grid costs they create, passed the House but died in the Senate in March 2026. Public utilities like Clark Public Utilities set rates through their own elected boards, which makes local commission races and rate hearings worth paying attention to.
What It Means for Homeowners
1. Plan for power that costs more, and make efficiency pay
Every projection points the same direction for the rest of the decade. That strengthens the case for the unglamorous stuff: LED lighting throughout, smart control of big loads, and right sized equipment. Clark Public Utilities offers rebates on qualifying upgrades, and for a home still on electric baseboard or an aging furnace, a ductless mini split or ducted heat pump is usually the biggest single lever. We compare the options in heat pump vs furnace in Vancouver, WA.
2. Take reliability into your own hands
Regional planners are warning that the margin between supply and peak demand is shrinking. When the grid runs tighter, weather events bite harder, and in Clark County the events that matter are winter ice storms and east wind events coming out of the Columbia River Gorge. For north county properties where an outage also means no well pump, a standby generator with an automatic transfer switch has shifted from a luxury to a practical hedge. We break down the federal outage numbers in how often the power goes out in Clark County.
3. Home EV charging still wins, if the installation is done right
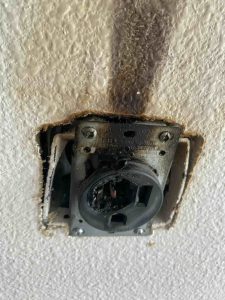
Despite the recent increase, Washington’s residential rates are far lower than the national average, meaning charging at home is still a much cheaper option per mile than gasoline. Clark Public Utilities also runs EV charger rebate programs. The real risk is on the installation side: EV charging is a heavy continuous load, and circuit sizing, receptacle quality, and conductor ampacity matter far more than the charger brand. That is where a licensed EV charger installer earns their keep.
4. Think about panel capacity before you need it
Between EV chargers, heat pumps, hot tubs, shop circuits, and backyard saunas, homes are being asked to carry more load than ever. If your service or panel is already near its limit, planning a panel replacement or service upgrade on your own schedule beats doing it in a rush when a new appliance forces the issue. We run the numbers in how much power a modern Vancouver home uses.
What It Means for Builders and General Contractors
The quieter consequence of the data center boom is a strained electrical supply chain. Data centers, grid expansion, and utility fleet replacement all pull from the same pool of transformers, switchgear, and breakers. Distribution transformer lead times that once ran a few months have stretched dramatically, large units are quoted in years, and national homebuilder groups have reported projects delayed simply waiting for a transformer.
For new construction in a growing county like ours, the practical takeaways are:
- Engage Clark Public Utilities early. Service applications, transformer requests, and meter sets should be moving while the foundation is going in, not after drywall.
- Lock in the electrical scope early. Washington’s 2021 energy code, in effect since March 15, 2024, steers new homes toward heat pumps for space and water heating, which puts more of the home’s load on the electrical service from day one. Late changes to service size are harder to absorb when equipment has lead times.
- Work with an electrical contractor who schedules tightly. In Clark County, electrical permits and inspections run through Washington L&I, so inspection timing is part of the schedule too. Continuous rough in trips, clean coordination with other trades, and committed dates matter more in this environment. See our Clark County electrical services.
- Future proof the service. Spec for the EV charger, the shop, the hot tub, and the sauna the buyer will want in five years. Conduit and capacity are cheap during construction and expensive afterward.
Common Questions
Are data centers the reason my electric bill went up?
Not directly, so far. Clark Public Utilities’ 14 percent average increase in March 2024 was driven by inflation, extreme weather, low water years, wholesale power prices, and state clean energy requirements. What data centers change is the regional picture: they are the biggest driver of new demand in the Northwest, and BPA tied its October 2025 wholesale rate increases to load growth. In the 13 state PJM grid back east, independent analysis attributes billions of dollars in recent capacity costs mainly to data center demand.
Will data centers raise Clark Public Utilities rates?
That depends on how large new loads are charged for the power and infrastructure built to serve them. Clark Public Utilities is a customer-owned utility that sells power at cost and sets rates through its elected Board of Commissioners. Most of its power comes from BPA, so regional supply costs flow through. Washington lawmakers debated making large data centers cover their own grid costs in 2026, and the bill died in the Senate, so this remains an open question worth following in local rate hearings.
Does rising demand mean more outages in Clark County?
Not automatically, but tighter supply leaves less cushion during extreme cold and heat, which is exactly when Clark County demand peaks. Most local outages still come from weather hitting the distribution system, such as ice storms and east wind events. For homes that cannot afford downtime, a standby generator with an automatic transfer switch is the most direct protection.
Is home EV charging still worth it in Washington with higher rates?
Yes. Washington’s average residential rate was 11.90 cents per kWh in 2024, well below the 16.48 cent national average, so charging at home costs a fraction of gasoline per mile. The bigger consideration is a safe, properly sized Level 2 installation, since EV charging is one of the heaviest continuous loads in a home.
Planning Electrical Work in a Changing Grid?
Whether you are sizing a panel for an EV charger, adding standby power, or scheduling electrical for a new build anywhere from Vancouver to Woodland, MAS Pro Services is a family owned electrical, plumbing, and HVAC contractor that will plan it right the first time.
Get in TouchSources
- Lawrence Berkeley National Laboratory, 2024 US Data Center Energy Usage Report and 2025 Update (US Department of Energy)
- US Energy Information Administration, average residential price by state (Table 5a) and Short-Term Energy Outlook
- PJM Interconnection base residual auction results; IEEFA, Projected data center growth spurs PJM capacity prices by factor of 10
- National Association of Realtors analysis of county level electricity rates, 2020 to 2024
- Bonneville Power Administration, BP-26 power rates, FY 2026 to 2028
- Northwest Power and Conservation Council, draft Ninth Northwest Power Plan and data center load forecasts
- Clark Public Utilities, 2026 Integrated Resource Plan Progress Report
- The Columbian, Clark Public Utilities rate increase, March 2024; Camas-Washougal Post-Record, Clark Public Utilities 2026 budget
- Washington State Standard, How WA lawmakers are trying to regulate data centers
- CISA National Infrastructure Advisory Council, Addressing the Critical Shortage of Power Transformers